EconDash
by EconDashCommunityEconomic and social data for 290+ countries and regions: GDP, inflation, unemployment, interest rates, population, health, education. 750+ indicators, each with source, licence and chart link.
EconDash connects AgentOne to a catalogue of 750+ statistical indicators in ten categories: macroeconomics, financial markets, labour, demographics, real estate, commodities and energy, transport and logistics, healthcare, education, and technology and internet. It covers 290+ countries and regional aggregates, with data from public sources such as the World Bank, IMF, FRED, Eurostat, ECB, OECD and WHO.
Ask AgentOne for a single figure, a recent series, or one indicator across up to 20 countries, or search the catalogue by topic. Every value comes with its period, unit, source, licence and a link to its EconDash chart page, so figures can be checked and cited. Projections such as IMF forecasts are labelled and kept apart from observed values, and a period without data is reported as missing, not filled in.
All tools are read-only. Five of the six work without an account. The full history of a series requires signing in to an EconDash account with full data access. Without that sign-in, AgentOne gets the latest values and a link to the chart with the whole history.
The server never takes payments and receives only the tool arguments (indicator, country codes, years, search words), not your conversation.
Tools
- compare_countries
- get_full_series
- get_indicator_details
- get_indicator_series
- list_countries
- search_indicators
- Made by
- EconDash
- Sign-in
- Optional
- Connection
- Connects online
- Server URL
- https://mcp.econdash.org/mcp
- Added
- October 2026
- More info
- DocumentationSupportPrivacy policy
Related extensions

TradingCalc
Exact trading math for AgentOne: Black-Scholes and options payoff, forex position size, VaR and Sharpe, plus crypto futures PnL and liquidation. Free, no signup.
by TradingCalc

Observatório BR
Official Brazilian economic data (IBGE, Central Bank, Treasury) with source, period and a link to the chart behind every number.
by Observatório BR

Quantcase
Research on ~2,000 NSE-listed Indian companies: scores, signals, briefs, screens, technicals and fundamentals.
by Quantcase

Resonanz X-Ray
Financial Analytics by Resonanz Capital
by Atanas Angelov

GuideFin
Learn about investing in India in plain language, starting with read-only mutual fund profiles, comparisons and category-relative ratings.
by Finthinkhub
Bitcoin Halving Cycles
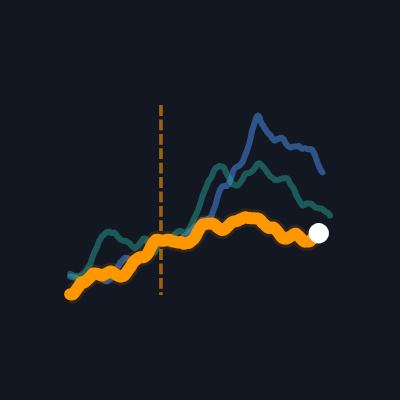
Live Bitcoin halving-cycle data: where today stands against the 2012, 2016 and 2020 cycles on the same day after each halving, the next-halving countdown, and past cycle highs and lows.
by N19 Trading